1.4 Node degree distribution
Recall, our definition of an undirected graph.
Definition 1: Undirected Graph
An undirected network is a set of nodes, \(\nu = \{\nu_1, \nu_2, \ldots, \nu_N\}\), and a set of edges, \(\epsilon = \{\epsilon_1, \epsilon_2, \ldots, \epsilon_K\}\), for \(K, N \in \mathbb{N}\) such that each edge in \(\epsilon\) connects an element in \(\nu\) to another (not necessarily distinct) element of \(\nu\).
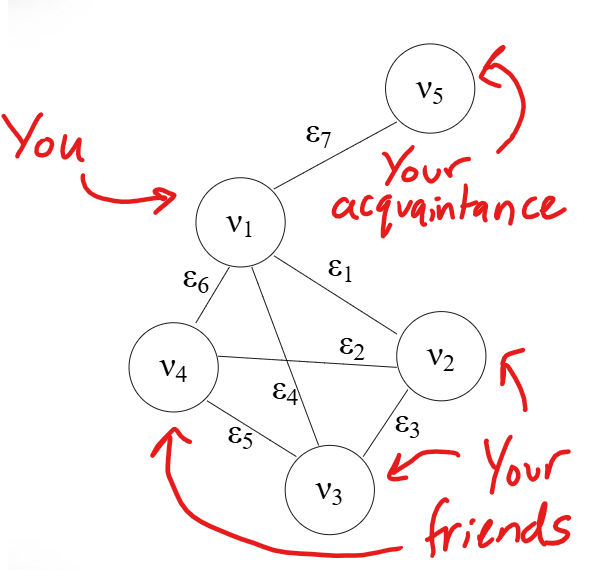
We will also reconsider our second example from the first post:

When looking at the global properties of networks, we often like to determine the node degree of each node within our network. It is then convenient for us to determine the probability distribution of node degrees (i.e., the probability of choosing a node with degree \(k\) out of all possible nodes \(N\)). Please see a formal definition of this distribution below:
Definition 2: Node Degree Distribution
Given an undirected network, \(G = \left\{ \nu, \epsilon \right\}\), with \(N\) nodes (as in Definition 1), the node degree distribution is a probability distribution, \(P(k)\), such that:
\[\begin{equation} P(k) = \frac{n_k}{N} \end{equation}\]where \(n_k\) is the number of nodes in the network with degree \(k\).
By counting the number of nodes with degree \(k\) and dividing by the total number of nodes, we are able to generate a discrete probability distribution for the node degree. Please see the node degree distribution for the network portrayed in Figure 1 below:
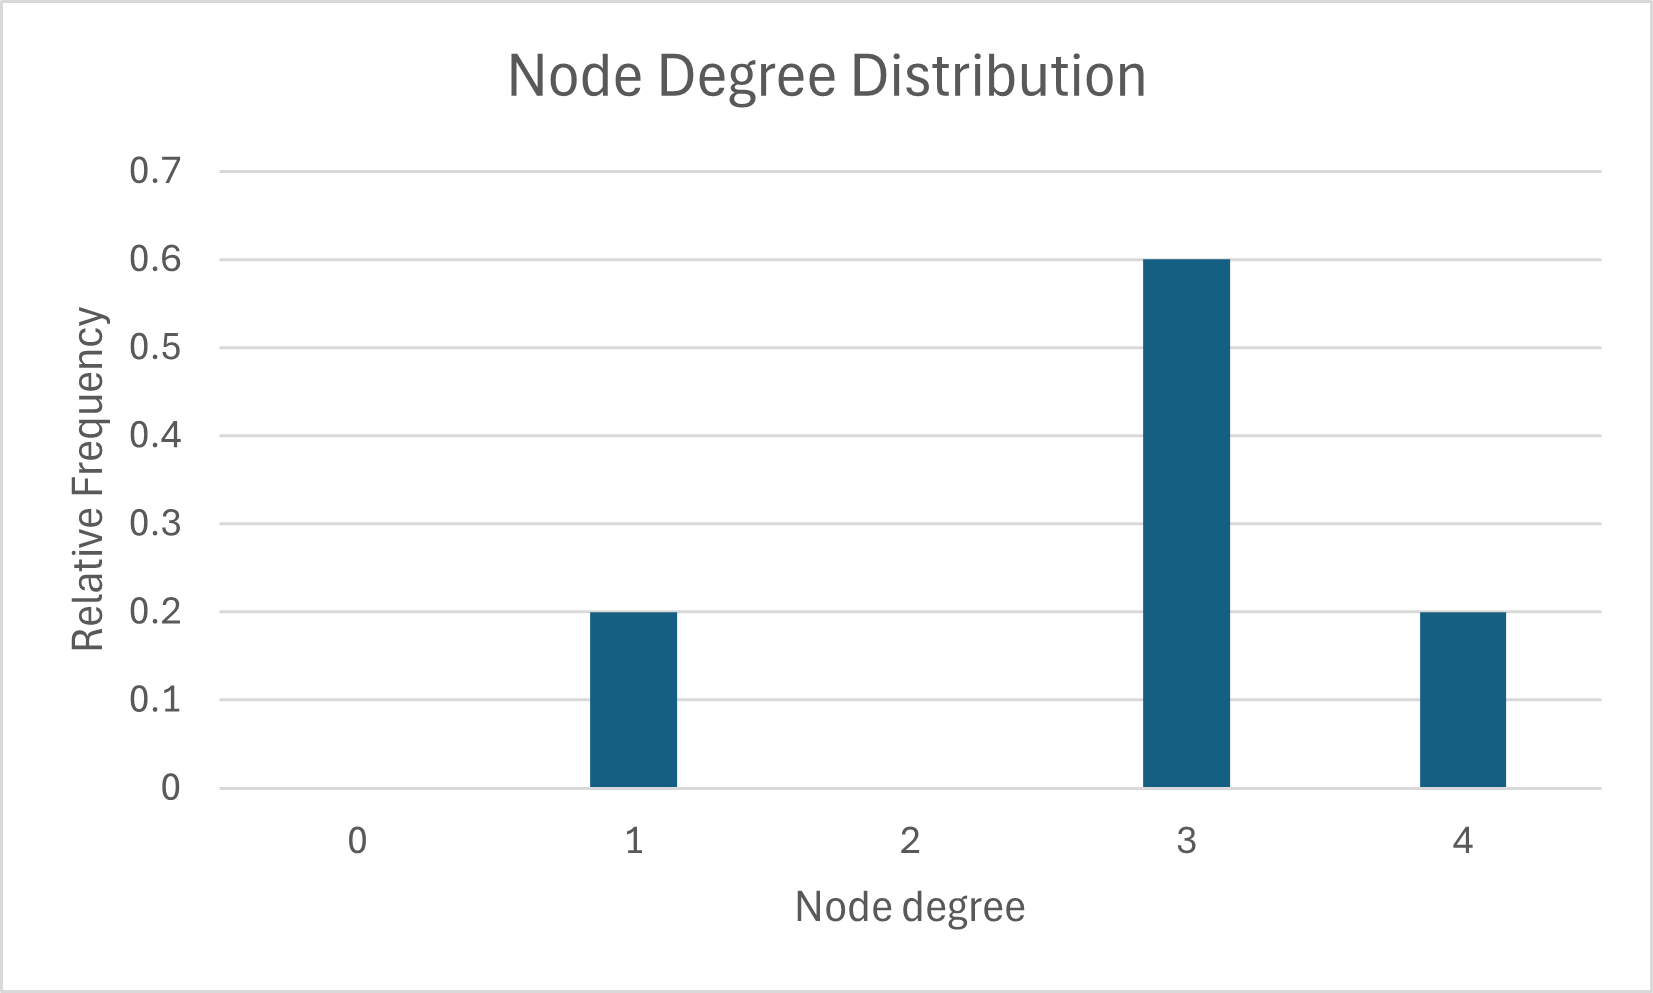
\[\begin{equation} P(k) = \begin{cases} \frac{1}{5} & \text{if } k = 1 \\ \frac{3}{5} & \text{if } k = 3 \\ \frac{1}{5} & \text{if } k = 4 \\ 0 & \text{ otherwise } \end{cases} \end{equation}\]It is customary to exclude the values of degree value \(k\) in the degree distribution for which there are no nodes present. Notice in our previous calculations that there was one node with degree one, three nodes with degree three, and one node with degree four. The node degree distribution is a probability distribution that encompasses the proportion of node degrees seen throughout the network.
I have plotted the relative frequency of each degree as a bar chart below:

